INDUSTRY REPORTS
2026 Social Media Benchmarks
Want to know how your brand stacks up on social? We analyzed performance data across 12 industries on TikTok, Instagram, and YouTube to help you see how your performance compares. From reach and engagement to format trends, these reports break down what’s working on each platform and where teams should focus next.

Social Media Benchmarks by Industry
Discovery is growing faster than engagement, and each platform plays a different role in achieving your goals. Smart teams are digging deeper into engagement, video views, and winning creative formats to see what works and why.


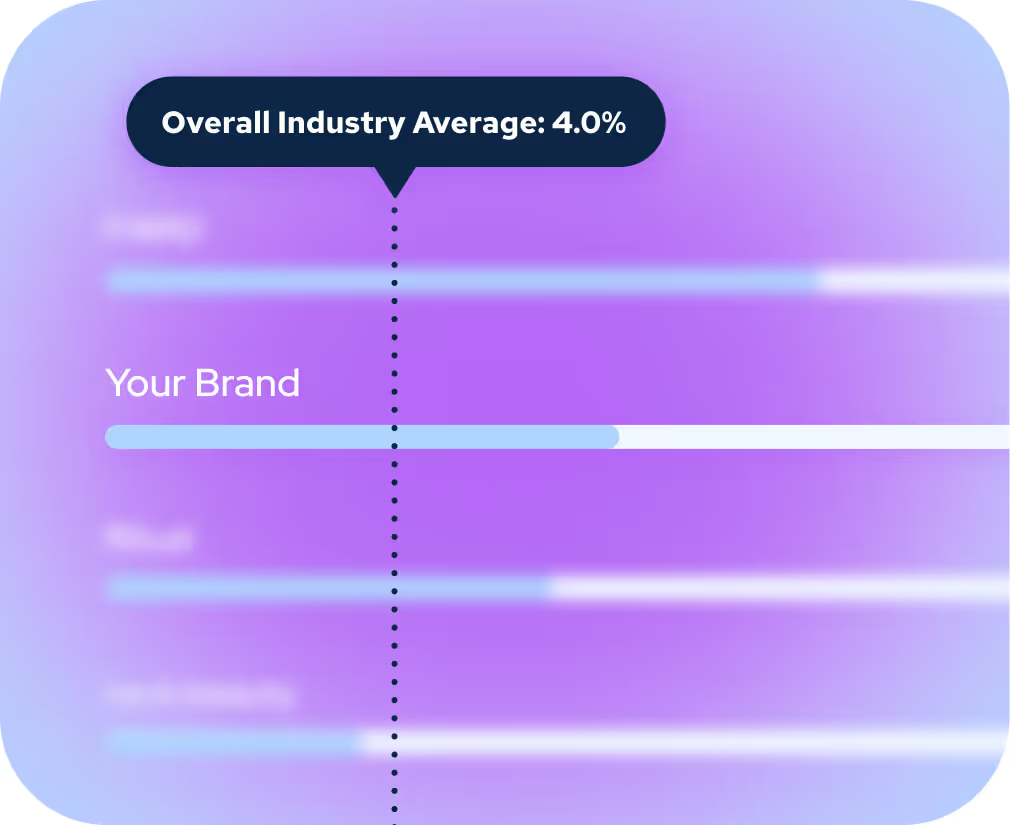
Why Are Social Media Benchmarks Important?
Benchmarks give context to performance, showing how your content compares across platforms that each play a different role. TikTok drives engagement, Instagram expands reach, and YouTube holds attention longer, so success isn’t measured the same way everywhere.
As views and Total Social Impact (TSI) increase across channels, engagement rates have balanced, indicating broader discovery, not weaker content. This focus helps teams understand what drives attention, shares, and views on each platform.
At Dash Social, our proprietary Entertainment Score helps quantify entertainment. It’s designed to measure how genuinely entertaining and engaging your content is, helping brands tap into what makes people watch and come back for more.

Benchmark Your Unique Competitive Landscape
Uncover social media benchmarks that are unique to your brand with Competitive Insights. Dash Social’s robust tools allow you to easily compare your performance with your top competitors and industry, giving you the insights to propel your strategy forward.
Available in Dash Social's Enterprise Plan